I speak toki pona , a constructed language. One of the many constrictions that this language has is a very limited number of color words. Specifically, there are only single words for white, black, red, yellow, and bluish-green. Of course, you can describe colors in other ways (use red and yellow to describe orange for example), but in practice, most people just use one word.
A website was created by jan Ke Tami where users are presented with a color, and asked to name it in toki pona (actually, a pair of colors, but that only provides slight bias for later). The ongoing results from this website are posted in a csv file here (warning: this is a download!)
So, I use this as an excuse to build my own neural network. Hopefully, this should be able to take red, green, and blue channel values as inputs, and one of the five color words as outputs. Afterwards, I expanded this network to handle the MNIST digits (as is neural network tradition).
This section will mostly be me explaining how neural networks work, so feel free to skip ahead if you want.
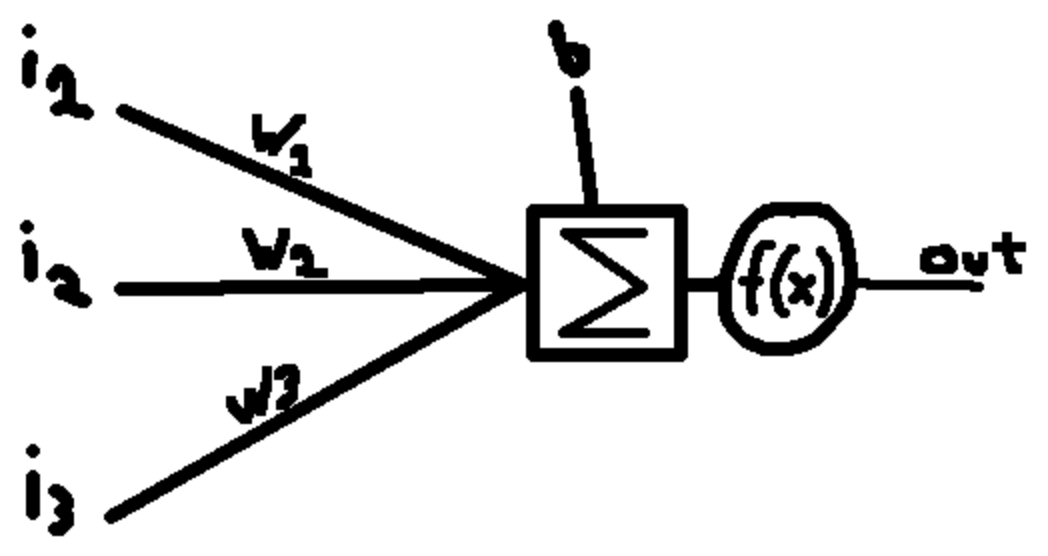
The building block of a neural network is a neuron, which works like this:
Here, the inputs (i1, i2, i3) are multiplied by each of their weights (w1, w2, w3). Then, they are all added together, along with a bias (b), and fed to an "activation function" f(x). The output (or "activation") of this function becomes one of the inputs for more neurons. Most often, this is done in "layers" of neurons. When you get enough layers, and enough neurons...
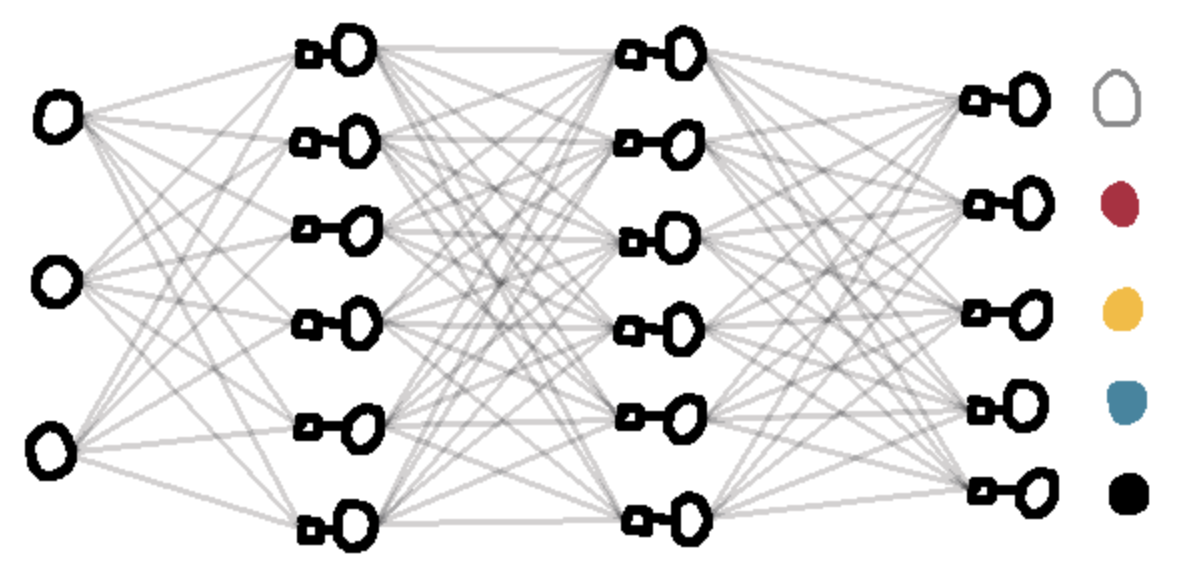
You can start to get a very complex system. In fact, most neural networks have far, far more neurons and layers. For this project, a system with only a few layers with a dozen or so neurons was acceptable, but systems can easily get to hundreds of neurons. To get a better sense for the terminology, look below:
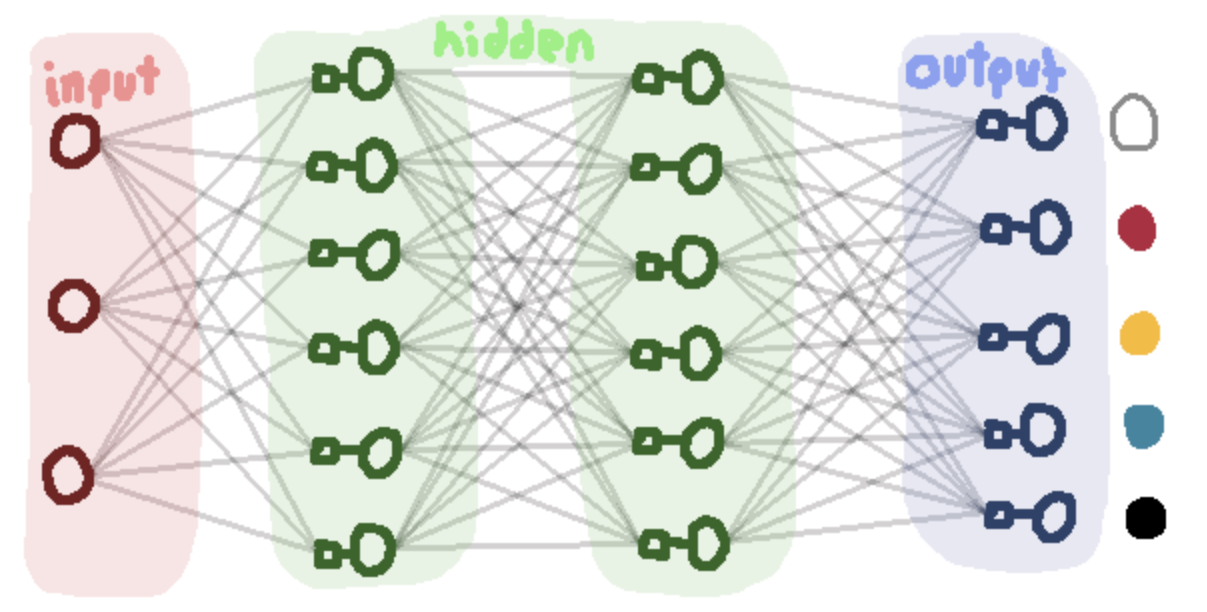
The data the network will receive is called the "input" layer (technically, not made of neurons). The middle processing steps are called "hidden" layers, and they tend to make up the bulk of the thinking. The last step is called the "output" layer, where the neural network outputs its confidence that any given output is correct.
Hopefully, it should have high confidence in the correct answer, and low confidence in the incorrect answers. However, a new network is likely to be wrong. We'd like to decrease the amount of wrongness over time, which means we need some metric to measure wrongness. The metric most people go for, and that I've done in this project, is to define a "correct" output as all 0s, except for the correct answer, which should be a 1. Then, take the sum of squared differences between the network's outputs and the correct outputs, and that's your "Loss."
Actually training the network is a much more complicated system, and sort of outside the scope of this writeup. However, the basic setup is this:
Over time, the network will get lower and lower loss values for any given input. There's actually a ton more to cover in regards to overfitting, AdamW weights, picking the right functions, etc, but the core of the idea is there, and now we can spend the rest of the write-up looking at some cool graphs.
Alright, after parsing the dataset, pruning out the invalid descriptions, building and training the network, here's the money shot:
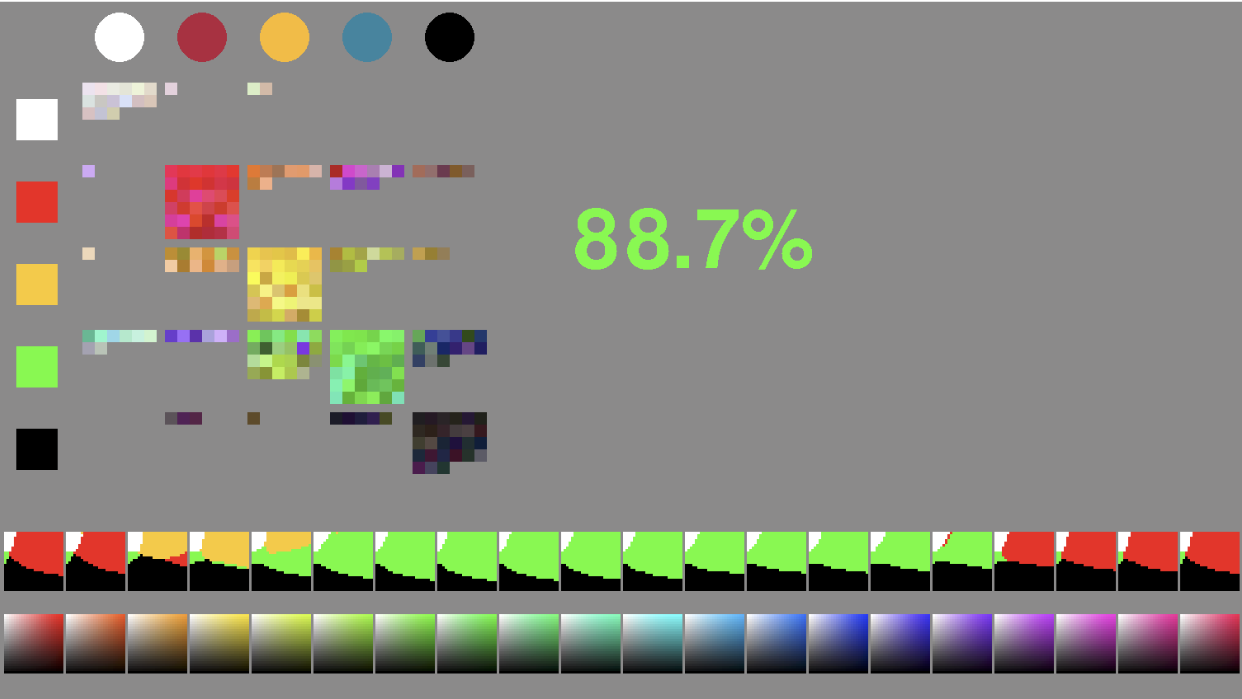
In big green numbers you can see the percent of colors the network classifies correctly. It might seem a bit low, but as we'll see in the last segment, it's about as high as anything can get.

At the bottom are two rows of boxes. The lower row is a series of slices of the HSV color space, 20 hues, 24 saturations, 24 values. The upper row is the network's classification for each color. This only updates every once in a while, because it takes some time to compute.
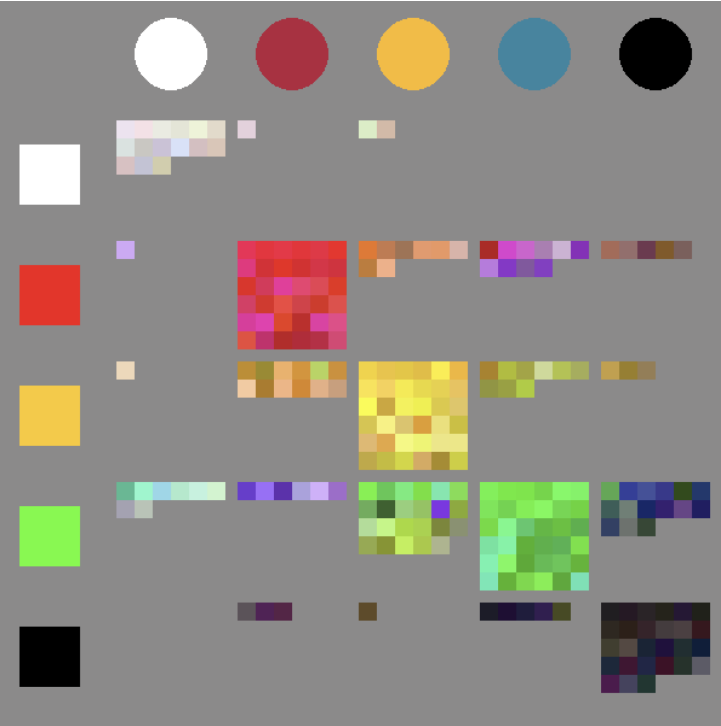
The columns (marked with circles) represent the human responses. Anything in that column was labeled by a human to be the color that I've put at the header. The colors for these were determined by some munsell standards, not that it particularly matters.
The rows (marked with squares) represent the network's responses. The actual colors for the boxes on the left are determined like this: every once in a while, the network looks at every color in the same HSV space as the boxes, and keeps track of the colors that lead to the highest activations of each output. The red of its red square is the color it considers the "most red."
At the intersections of these, we can see agreements and disagreements, both ordered by how sure the network is of its answer. In the disagreements, we can see why this network will never have 100% consistency: humans disagree with each other. This is very visible in this example:
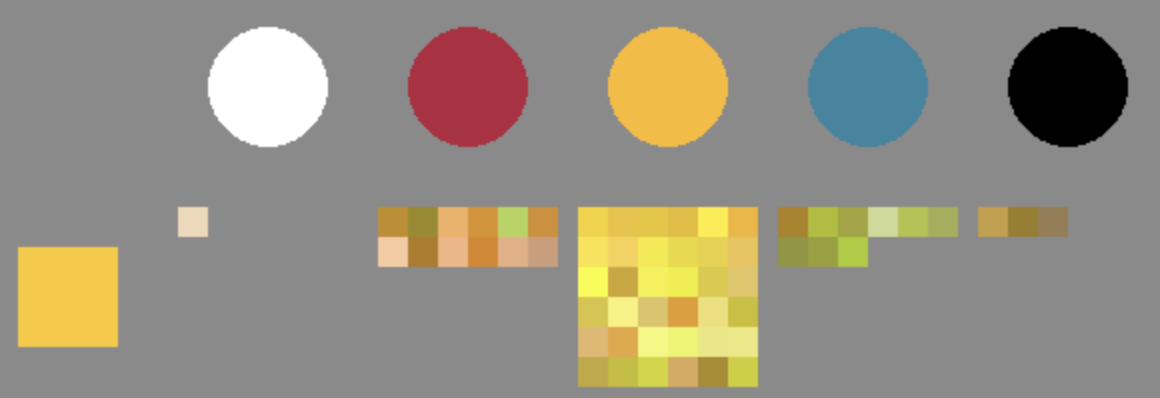
Nearly all the colors are the same, yet some humans have provided... "creative" categorizations. (Actually, I believe the wide breadth of "yellow" proves the existence of some very interesting behavior involving the word's small semantic space [compare the area of "yellow" to the area of "blue-green" on a color wheel], and speakers' subsequent attempt to use the word for more broad hues, going into lime-green. Of course, there's a split about whether or not to do this, so you get disagreement!)
Nevertheless, these are provided as "correct" answers, and if I were to go in and prune it, I would have a network for my color perception, but not for the toki pona community's. So, at 88.7% this network will remain...
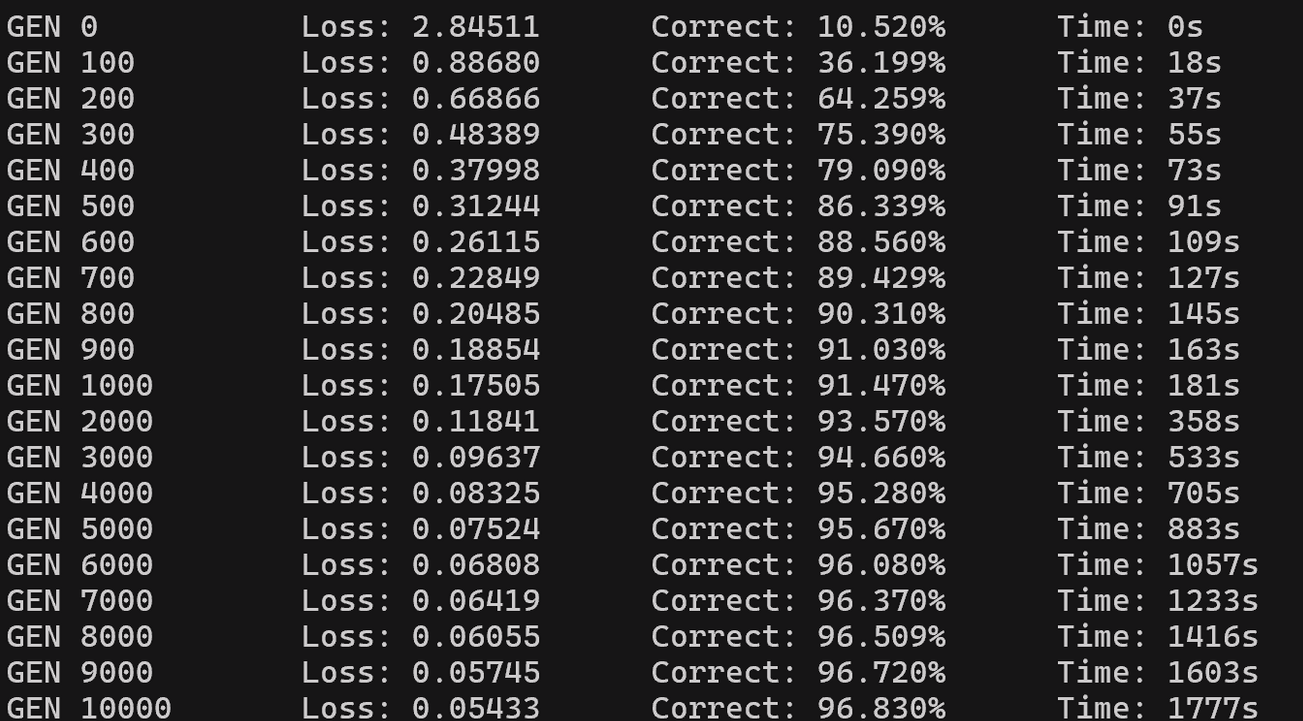
This was all written in Python, so it ran painfully slow, and I was also starting to doubt if my handwritten neural network classes were really doing the best they could when it came to the poor 88.7% performance. So, I rewrote the entire thing in C# for performance, and set it on the MNIST dataset for consistent answers. The MNIST is a large collection of handwritten digits, all normalized and grayscaled and everything. They're a standard for testing all sorts of algorithms like these, and after finding the inputs in a tidy csv, rather than the odd format they provide, I got my answers. My network is great!
 ...
...

It quickly ramps to ~90% correct, spends 30 minutes getting to ~97%, and then ekes out to 98% over the course of several hours.